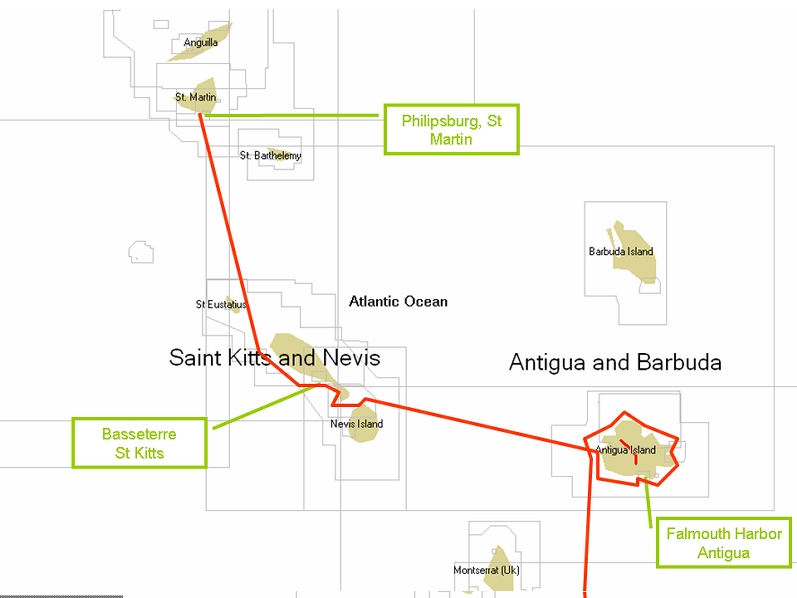
Chart – Saba and St Martin
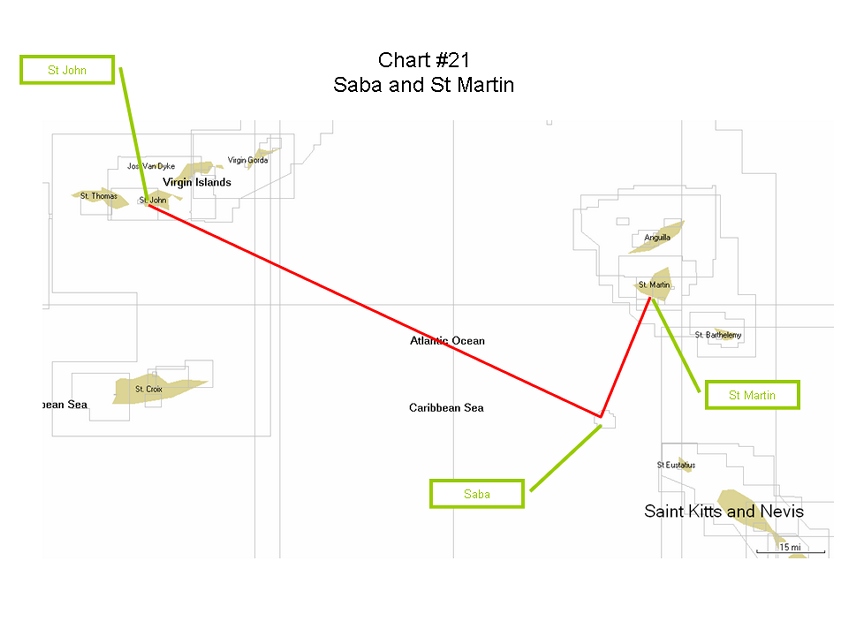
Chart – Guy’s Weekend Circumnavigating Tortola
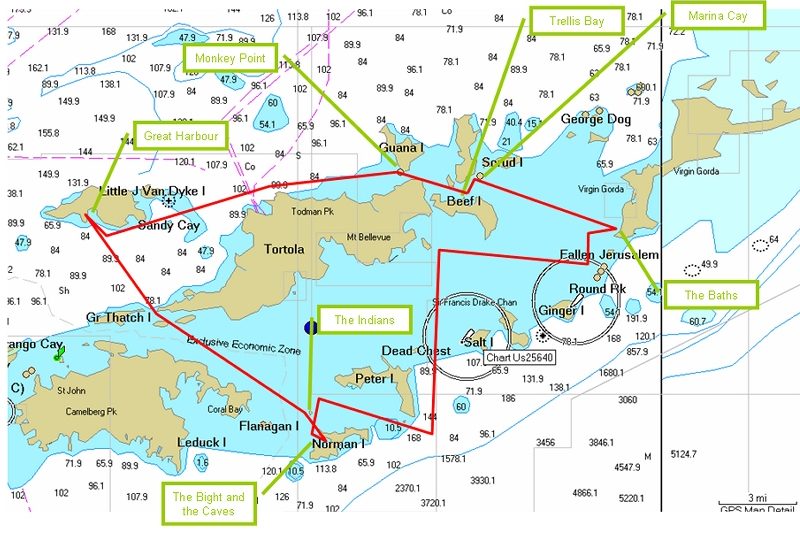
Chart – Deadman’s Bay, Jost Van Dyke, etc
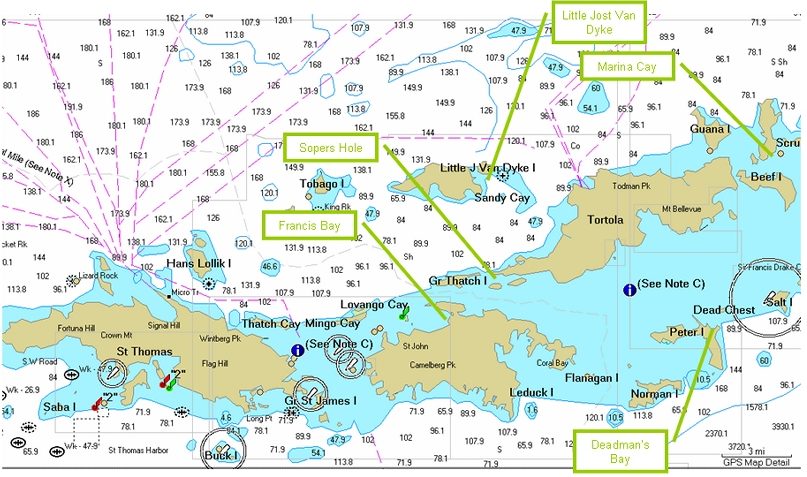
Chart – Tortola, BVI’s and St John, USVI’s
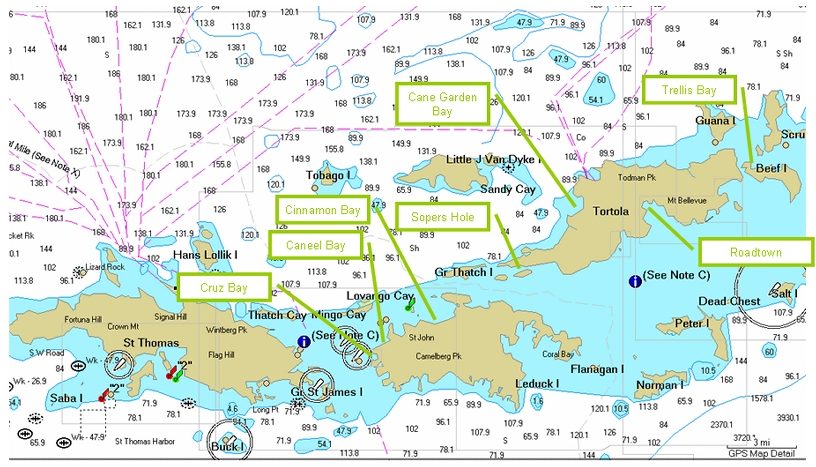
Chart – St John and St Thomas, USVI’s
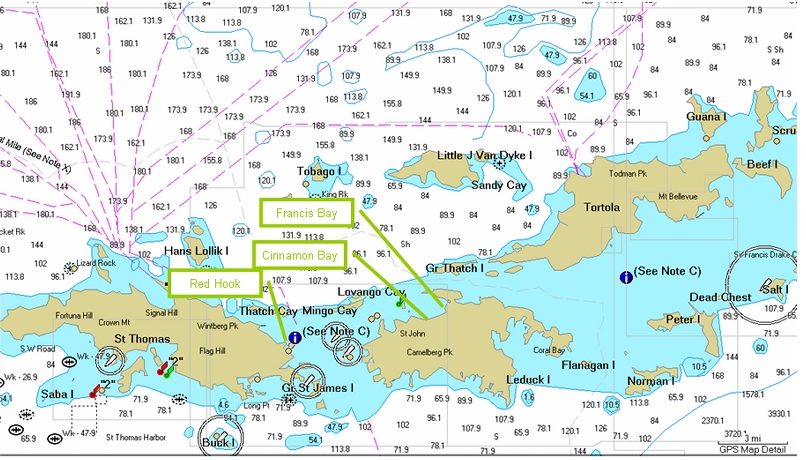
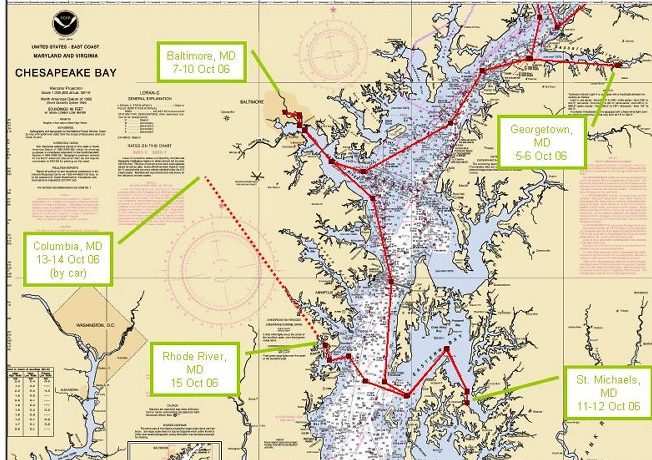
Chart – Rhode River, MD to Washington, D.C.
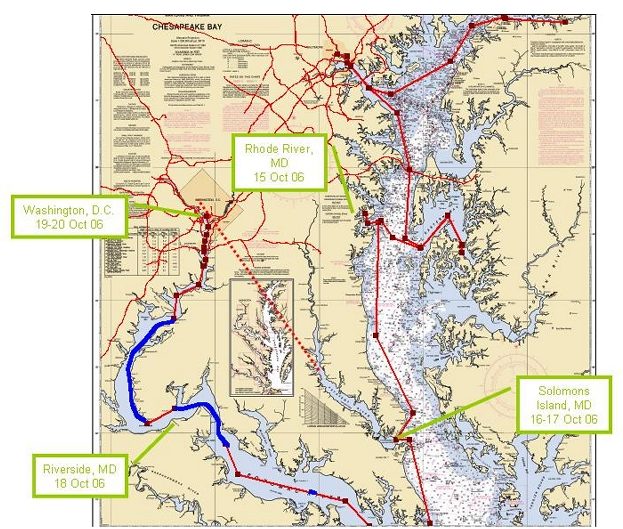
Chart – Georgetown, MD to Rhode River, MD
Civics Assignment Ep. 20
By Zachary
For my Civics class, I have recently completed a survey of 16 friends/relatives and their volunteer hours over the recent past. So that I could easily represent this data, I asked that the hours be submitted into one or more of these 6 categories: School, church, hospital, community, coaching, and other. To those of you that I e-mailed in September, thanks for participating. Sorry I could not update this sooner- I have been very busy. As I read the e-mailed responses, I converted all of the data into percentages, forgetting that I had no easy way to represent this in a graph. I then assumed that the average hours spent volunteering in the recent past would be 100 hours of volunteer work. So I converted all of the percentages back into hours. These are the results in a bar graph:

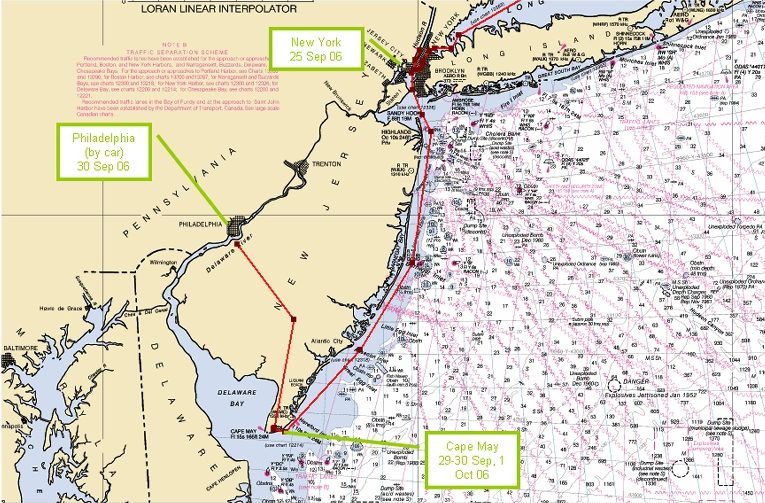
Chart – New York City to Cape May, NJ
